Published in: n.d.
Pages: 5
Publisher:
IFRC
Author:
IFRC
Uploaded by:
SuSanA Admin
Partner profile:
common upload
1072 Views
22 Downloads
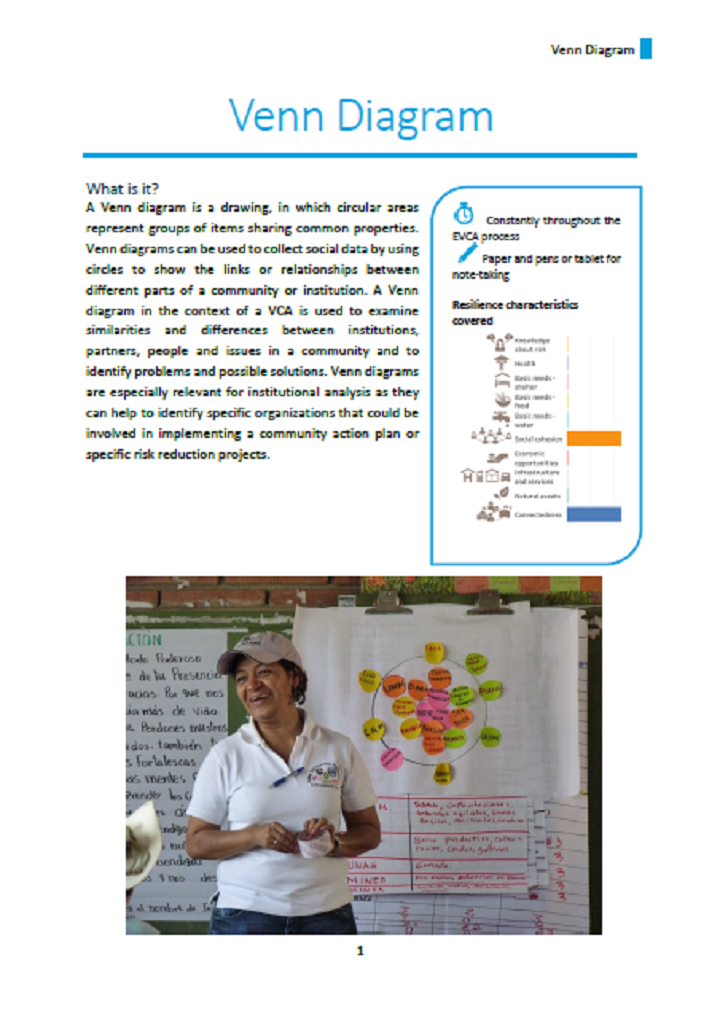
A Venn diagram is a drawing, in which circular areas represent groups of items sharing common properties. Venn diagrams can be used to collect social data by using circles to show the links or relationships between different parts of a community or institution. A Venn diagram in the context of a VCA is used to examine similarities and differences between institutions, partners, people and issues in a community and to identify problems and possible solutions. Venn diagrams are especially relevant for institutional analysis as they can help to identify specific organizations that could be involved in implementing a community action plan or specific risk reduction projects.
Bibliographic information
IFRC (n.d.). Venn Diagram. EVCA Toolbox. IFRC
Filter tags
English Guidelines and manuals


